Every human being must know about these 3 financial statements in order to stay safe from the financial crisis. it also helps create more wealth in passive modes.
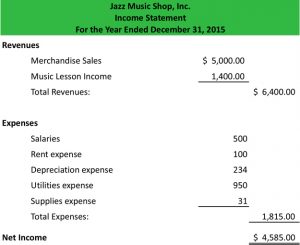
- PL (Profit & Loss Account) also Known as (Annual Income Statment)
- Balance sheet (Details about Assets-liabilities)
- Cash flow (Its simple to understand is your cash flowing to liabilities or assets from PL salary, business etc)
Robert Kiyosaki Model (author of rich dad poor dad)
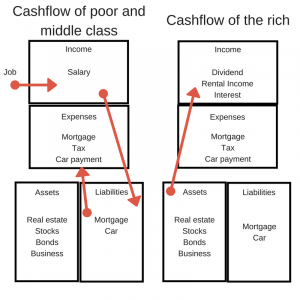
From the above image: You can understand is your monthly income flowing to asset or liability. (Earn>>save>> spend).
Balance sheet example
| Mar 2019 |
Mar 2018
|
|
|---|---|---|
| Total Share Capital | 6,339.00 | 6,335.00 |
| Equity Share Capital | 6,339.00 | 6,335.00 |
| Share Application Money | 0.00 | 15.00 |
| Preference Share Capital | 0.00 | 0.00 |
| Reserves | 398,983.00 | 308,297.00 |
| Revaluation Reserves | 0.00 | 0.00 |
| Networth | 405,322.00 | 314,647.00 |
| Secured Loans | 157,195.00 | 2,153.00 |
| Unsecured Loans | 0.00 | 94,682.00 |
| Total Debt | 157,195.00 | 96,835.00 |
| Total Liabilities | 562,517.00 | 411,482.00 |
| Gross Block | 314,745.00 | 313,666.00 |
| Less: Accum. Depreciation | 0.00 | 112,702.00 |
| Net Block | 314,745.00 | 200,964.00 |
| Capital Work in Progress | 0.00 | 99,483.00 |
| Investments | 331,536.00 | 225,222.00 |
| Inventories | 44,144.00 | 39,568.00 |
| Sundry Debtors | 12,110.00 | 10,460.00 |
| Cash and Bank Balance | 3,768.00 | 2,731.00 |
| Total Current Assets | 60,022.00 | 52,759.00 |
| Loans and Advances | 69,442.00 | 39,097.00 |
| Fixed Deposits | 0.00 | 0.00 |
| Total CA, Loans and Advances | 129,464.00 | 91,856.00 |
| Deffered Credit | 0.00 | 0.00 |
| Current Liabilities | 209,962.00 | 202,920.00 |
| Provisions | 3,266.00 | 3,123.00 |
| Total CL and Provisions | 213,228.00 | 206,043.00 |
| Net Current Assets | -83,764.00 | -114,187.00 |
| Miscellaneous Expenses | 0.00 | 0.00 |
| Total Assets | 562,517.00 | 411,482.00 |
| Contingent Liabilities | 0.00 | 66,970.00 |
| Book Value (Rs) | 639.41 | 496.68 |
Profit & Loss Account Example
| March 2019 |
March 2018
|
|
|---|---|---|
| Sales Turnover | 371,019.00 | 315,357.00 |
| Excise Duty | 0.00 | 25,315.00 |
| Net Sales | 371,019.00 | 290,042.00 |
| Other Income | 9,419.00 | 8,220.00 |
| Stock Adjustments | 3,294.00 | 3,232.00 |
| Total Income | 383,732.00 | 301,494.00 |
| Raw Materials | 273,577.00 | 210,673.00 |
| Power and Fuel Cost | 0.00 | 13,565.00 |
| Employee Cost | 5,834.00 | 4,740.00 |
| Other Manufacturing Expenses | 0.00 | 0.00 |
| Selling and Admin Expenses | 0.00 | 0.00 |
| Miscellaneous Expenses | 36,645.00 | 12,555.00 |
| Preoperative Exp Capitalised | 0.00 | 0.00 |
| Total Expenses | 316,056.00 | 241,533.00 |
| Operating Profit | 58,257.00 | 51,741.00 |
| PBDIT | 67,676.00 | 59,961.00 |
| Interest | 9,751.00 | 4,656.00 |
| PBDT | 57,925.00 | 55,305.00 |
| Depreciation | 10,558.00 | 9,580.00 |
| Other Written Off | 0.00 | 0.00 |
| Profit Before Tax | 47,367.00 | 45,725.00 |
| Extra-ordinary items | 0.00 | 0.00 |
| PBT (Post Extra-ord Items) | 47,367.00 | 45,725.00 |
| Tax | 12,204.00 | 12,113.00 |
| Reported Net Profit | 35,163.00 | 33,612.00 |
| Total Value Addition | 42,479.00 | 30,860.00 |
| Preference Dividend | 0.00 | 0.00 |
| Equity Dividend | 0.00 | 3,255.00 |
| Corporate Dividend Tax | 0.00 | 661.00 |
| Shares in issue (lakhs) | 63,390.00 | 63,346.51 |
| Earning Per Share (Rs) | 55.47 | 53.06 |
| Equity Dividend (%) | 0.00 | 60.00 |
| Book Value (Rs) | 639.41 | 496.68 |
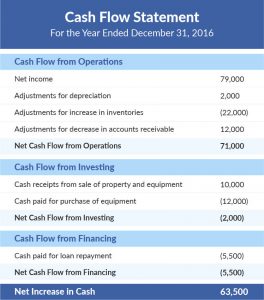
Cash Flow Statment Example
|
Cash Flow of Reliance Industries |
——————- in Rs. Cr. ——————- |
| Mar ’18 | Mar ’17 | Mar ’16 | Mar ’15 | Mar ’14 | ||||||
| 12 mths | 12 mths | 12 mths | 12 mths | 12 mths | ||||||
| Net Profit Before Tax | 45725.00 | 40777.00 | 35701.00 | 29468.00 | 27818.00 | |||||
| Net Cash From Operating Activities | 62000.00 | 51450.00 | 0.00 | 35285.00 | 42160.00 | |||||
| Net Cash (used in)/from Investing Activities |
-59109.00 | -54949.00 | 0.00 | -55998.00 | -64013.00 | |||||
| Net Cash (used in)/from Financing Activities | -1914.00 | -1639.00 | 0.00 | -940.00 | 5530.00 | |||||
| Net (decrease)/increase In Cash and Cash Equivalents | 977.00 | -5138.00 | -4679.00 | -21653.00 | -16323.00 | |||||
| Opening Cash & Cash Equivalents | 1754.00 | 6892.00 | 11571.00 | 33224.00 | 49547.00 | |||||
| Closing Cash & Cash Equivalents | 2731.00 | 1754.00 | 6892.00 | 11571.00 | 33224.00 | |||||
For fundamental analysis of companies /stock market
balance sheet
| Human | Company |
| Assets | share capital |
| Income | Reserves |
| loans, | debt |
Rule:
- Company does;t need to sell its share capital (no dilution)
- reserves (income keep growing
- debt (need to decrease)
| Metrics | Growing company | Avg company | The poor performance of the company |
| Share Capital | increase | increase | no change |
| Reserves | increase | no change | low constant |
| Debt | Decrease | no change | increase |
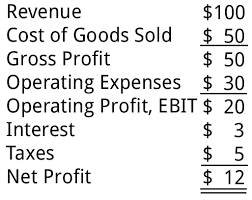
Profit Loss Account / PL / Income Statment
- interest paying to loan decrease
- PBIT (Profit Before Tax) (also has to be high)
- employee cost (increase)
- consumption of raw materials (increase indicates higher production)
- net profit (should increase)
Cash Flow Statment
- From financial Activities >> To pay the loan (It’s a negative cash Flow)
- from investment Activities >> ROI Maybe Positive
- From Operating Activities >> operating income also a positive flow.
financial ratios
| Mar 2008 |
Mar 2007
|
|
|---|---|---|
| Face Value | 10.00 | 10.00 |
| Dividend Per Share | 13.00 | 11.00 |
| Operating Profit Per Share (Rs) | 154.32 | 146.44 |
| Net Operating Profit Per Share (Rs) | 920.48 | 801.57 |
| Free Reserves Per Share (Rs) | 520.59 | 416.90 |
| Bonus in Equity Capital | 33.14 | 34.57 |
| Operating Profit Margin(%) | 16.76 | 18.26 |
| Profit Before Interest And Tax Margin(%) | 13.06 | 13.90 |
| Gross Profit Margin(%) | 13.14 | 13.95 |
| Cash Profit Margin(%) | 13.73 | 15.13 |
| Adjusted Cash Margin(%) | 13.73 | 15.13 |
| Net Profit Margin(%) | 14.54 | 10.69 |
| Adjusted Net Profit Margin(%) | 14.45 | 10.64 |
| Return On Capital Employed(%) | 15.68 | 18.00 |
| Return On Net Worth(%) | 24.66 | 19.49 |
| Adjusted Return on Net Worth(%) | 17.28 | 19.85 |
| Return on Assets Excluding Revaluations | 542.74 | 439.57 |
| Return on Assets Including Revaluations | 548.73 | 458.61 |
| Return on Long Term Funds(%) | 17.18 | 19.83 |
| Current Ratio | 0.98 | 0.77 |
| Quick Ratio | 0.89 | 0.69 |
| Debt Equity Ratio | 0.46 | 0.45 |
| Long Term Debt-Equity Ratio | 0.35 | 0.32 |
| Interest Cover | 17.05 | 13.51 |
| Total Debt to Owners Fund | 0.46 | 0.45 |
| Financial Charges Coverage Ratio | 19.95 | 16.06 |
| Financial Charges Coverage Ratio Post Tax | 21.90 | 13.90 |
| Inventory Turnover Ratio | 10.57 | 10.65 |
| Debtors Turnover Ratio | 26.87 | 28.29 |
| Investments Turnover Ratio | 10.57 | 10.65 |
| Fixed Assets Turnover Ratio | 1.29 | 1.13 |
| Total Assets Turnover Ratio | 1.14 | 1.22 |
| Asset Turnover Ratio | 1.28 | 1.37 |
| Average Raw Material Holding | 33.46 | 20.91 |
| Average Finished Goods Held | ||
| Number of Days In Working Capital | 51.39 | 37.01 |
| Material Cost Composition | 73.86 | 72.32 |
| Imported Composition of Raw Materials Consumed | 93.96 | 94.04 |
| Selling Distribution Cost Composition | 2.41 | 3.27 |
| Expenses as Composition of Total Sales | 56.80 | 52.40 |
| Dividend Payout Ratio Net Profit | 8.38 | 12.06 |
| Dividend Payout Ratio Cash Profit | 6.71 | 8.59 |
| Earning Retention Ratio | 88.04 | 88.16 |
| Cash Earning Retention Ratio | 91.18 | 91.52 |
| adjusted cash Flow Times | 1.97 | 1.64 |
| Earnings Per Share | 133.86 | 85.71 |
| Book Value | 542.74 | 439.57 |
liquidity, profitability, debt, and asset management,
- debt-to-asset ratio (total liabilities / total assets),
- working capital ratio (current assets / current liabilities),
- quick ratio or acid test ((current assets – inventory) / liabilities),
- inventory turnover (cost of goods / average inventory)
- (PE Ratio) price-to-earnings ratio (stock price/earnings per share),
- EPS earning per share
the intrinsic value of a stock (refers to the actual value of company stock rather trading on the stock exchange)
Book Value / Share = (Total Assets – Total Debt) / No. of shares
Face value is the Equity Share Capital / No. of Shares
EPS=net profit/no of shares
Earnings per share=Net income – preferred dividends/End – of – period common shares outstanding
To Know Company stock Undervalued/ lower valued
P/E Ratio= Market value per share/Earnings per share overvalued or undervalued, the P/E
E in P/E refers to EPS (premium trading higher than actual company value & discount trading low value than the intrinsic value.
P/E ratio = X times if company 1000cr then pe ration 12x then u have to buy it at 12000cr (because of dividends, earning growth=premium)
if it lower than industry pe then it is undervalued
PEG Ratio=Price/EPS growth // low is better
the expected growth rate for the stock (3 -5 years avg earnings)*
and much 10+ analysis there in the market.
Current Ratio = Current Assets/Current Liabilities.
Quick Ratio = Current Assets-Inventory/Current Liabilities.
short-term debt without selling inventory
Net Working Capital = Current Assets – Current Liabilities
ROE (Return on Equity)= Net income/shareholders equity (available in financial ratios of the company).
book value or shareholders equity = Net worth (Assets-liabilities)
ROI (Returns on investment)
ROA >> Return on Asset.
Faqs
1.what is the difference between Gross Block and Net Block?
Gross block: all assets of the company.
Netblock is the gross block –accumulated depreciation.