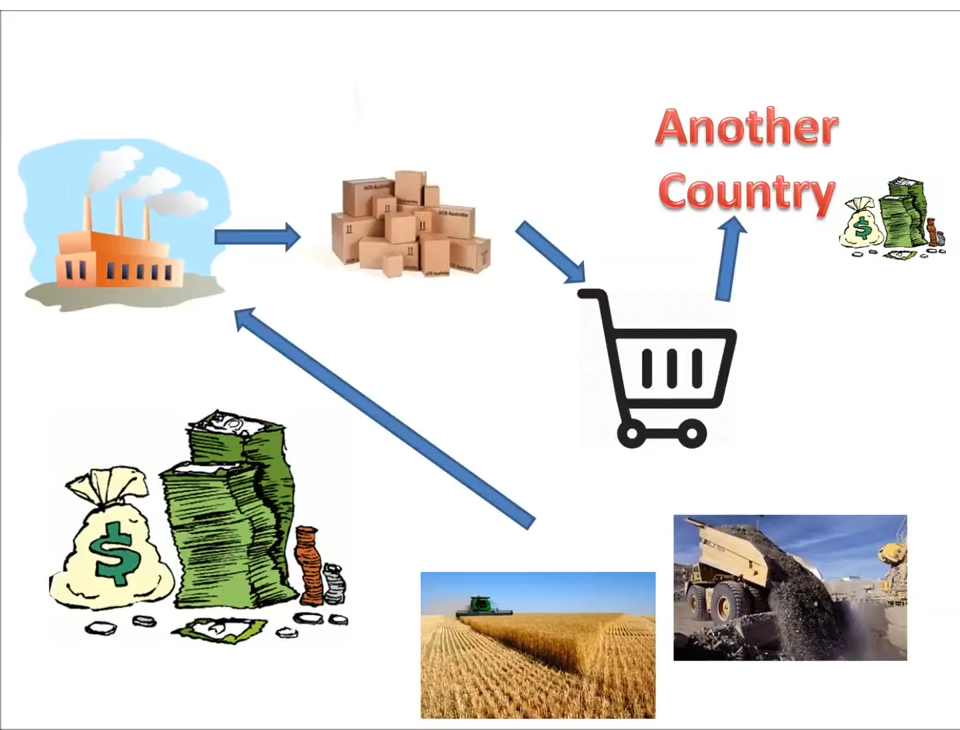
Simple economy = Production + Consumption
Debt + Production = Consumption
People Money >> Bank saving / Fixed (4-7%) >> bank Loan to people /business (10-15%) >> debt at 15% manufacture at 30-59% margin >> net profit 10-30%.
When loan not repays due to certain issues pandemic virus, disasters, management issues etc.
how does an economy grow
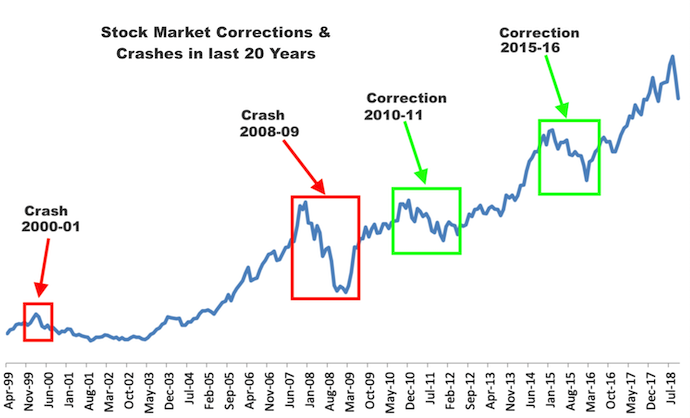
economic depression vs recession
A recession is a normal lasts for several months/quarters ( 4 quarters /year). A depression, on the other hand, is an extreme fall in economic activity that lasts for years.
why 2008 crisis not termed as depression
How The Economic Machine Works by Ray Dalio (youtube)
The [economic] machine works in the same way for an individual. A country is nothing more than the collection of its individuals or companies.” — Ray Dalio
Economy Growth rate constantly at low 2% in america 4-7% in developing countries.
People need more comfort, ex: the king has lot wealth, but he used a horse to ride, slept at no fan and AC.
now people need cars (life time 5-10 years), Every product has some life span, so that has to build again.
farming with bulls vs tractors. (utilizing natural resources water,land,iron etc).
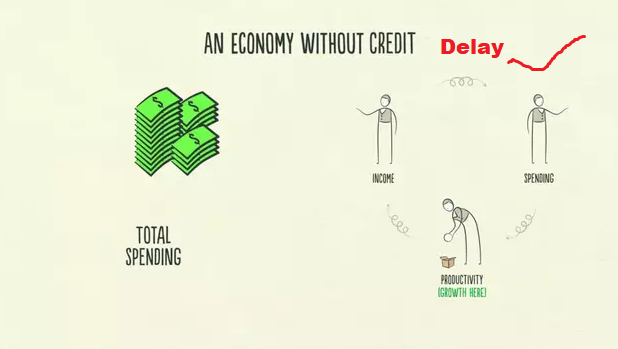
part 1: economy as transactions without credit
A: made a product, sold to B, B completed transaction.
A: again started with (have to wait until its sold without debt).
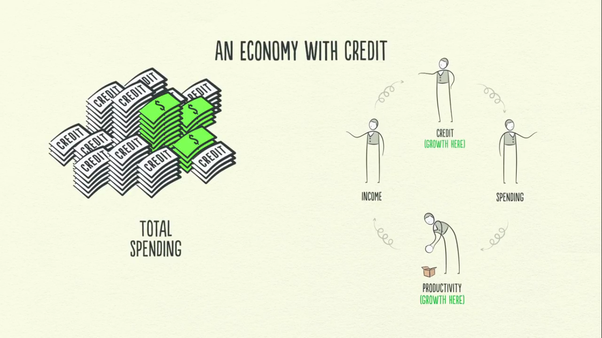
Transactions
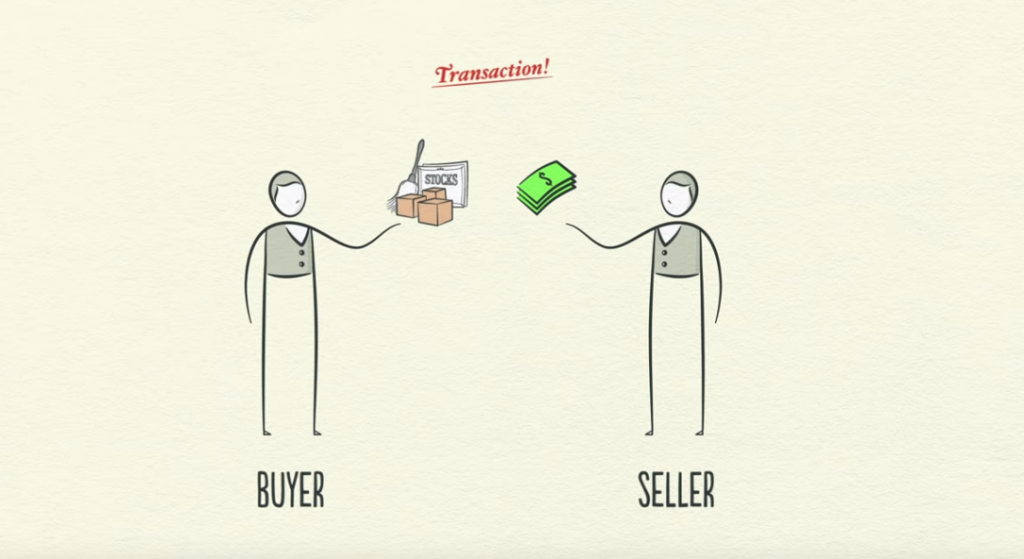
transaction = money for exaching goods or services.
money = cash + credit (loan)
Credit: increases the buying power. spending other person income. you spend other earns,
Market = buyers and sellers making transactions
Central Government: Biggest buyer / seller in the market the (collect taxes & spend money)
Central bank: Controls amount of money and Credit (printing money & setting interest rates)
Economy Cycles & credit
what you get its depends on productivity,
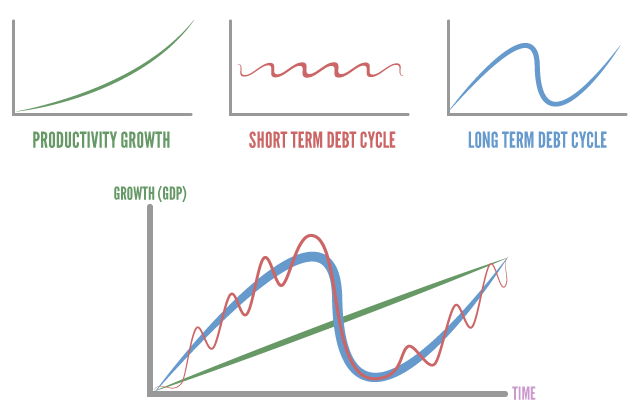
productivity matters in the long run but credit matters in the short run.
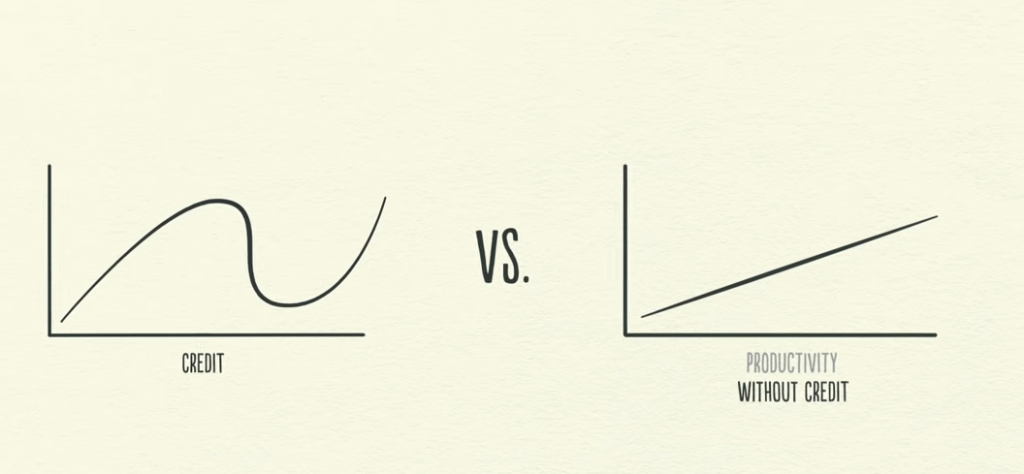
Productivity growth is linear.
But use of Credit leads to economy cycle.
Ex: you bought a product without paying anything Zero Cost EMI, worth 30K from B with the help of C.
The cycle grows by credit+money. if you not repaid then, the cycle goes down, (you have to pay to C, C has to pay B, B has to pay D the banK, D has to pay people like you people money, government settles this by printing money and reducing interest rates).
Short Cycles: once in 4-5 years.
Long term cycles: once in 75-100 years.
Cycles occurs due to human nature.
Bad: finances over-consumption that can’t be paid back. ex buying a Tv
Good: financing for a tractor for agriculture increases productivity.
good debt vs bad debt
when take a loan at 5%, earned 15%. paid 5% net profit 10%. that’s grows economy. if negative you may unable to pay the debt.
Interest rates: when low people /business lend consumer & produce. then demand increases price gets higher, loan rates also higher then it equals)
Short-Term Debt Cycle:
first phase: people / businesses borrow / lend money to each other — there’s economic growth.
inflation: when spending & income increases more than productivity.
when inflation gets high
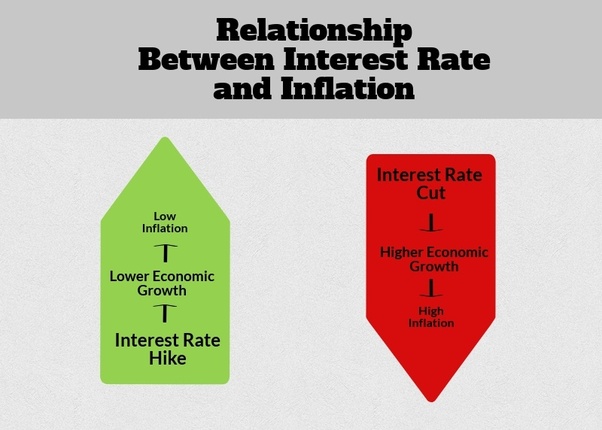
central bank increases the interest rates.
costlier to borrow = lower spending means lower earnings of other. low spending = price down fall
Deflation: price of consumer goods lower than actual value.
Economy recession: Less transactions No buying + No Selling = Less Productivity.
Central bank Decreases the Interest rates.
credit is available, there’s an economic expansion,” “When credit isn’t available, there’s a recession.
Controls by Government lasts for 5-8 years).
Long-Term Debt Cycle in economy
as economy grows, the price of assets grows ex: home, gold, cars, etc.
People borrow more money & feels wealthy.
when the debt burden not manageable by income. >> people spend less (one person spend is other person income) >> less borrowing>>
meanwhile debt repayment continue to increases>> spending drop even further>> (stock market crash, economy shrink)
People feel poor: wanna sell assets when there is market fall & less spend.
They spend less & credit disappears. bank interest rates already zero. (so central bank cannot reduce it)
getting out of this cycle
- Spend less
- pay debt including debt
- Redistribute wealth (tax and social programmes)
- Print money (more productiveness by individuals)
Economy depression
spending less to reduce debt burden leads to economy recession. (on person’s spending is another person’s income,).
Government spends more than its collected taxes.
increases taxes on rich (tension between economic classes ,if its longs tensions become explosive)
To redistribute wealth, central bank prints the money it leads to inflation
government has to balance both inflationary and deflationary policies.
A Beautiful Deleveraging
debts decline relative to income & economy growth.
a dollar of spending with money equals 1 dollar credit.
printing money to lower the debt.
print enough money to get the rate of income growth greater than rate of interest paid on existing debt
slow income growth & slow debt leads equal economy. but its takes a decade.
Economy without Credit
Follow his channel & website https://economicprinciples.org/
GDP vs NDP vs GNP vs NNP
NDP (net domestic product) : value of spending to maintain current GDP or GDP – depreciation on a country’s /consumed capital goods
GNP ( gross national product ): net income receipts from abroad
NNP (Net national product): = GNP – Depreciation
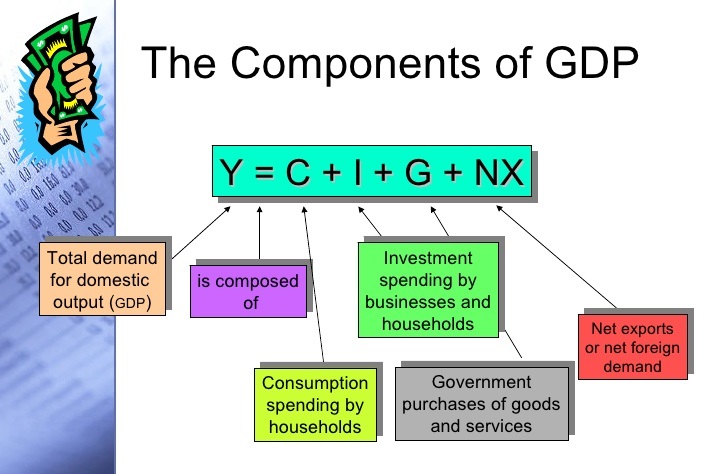
GDP (value of all the goods and services in the country)
or
GDP: within territory + mnc companies income within country – foregin income
GNP= GDP + foregin income – mnc companies income within country (GDP- NFIA)
NDP= GDP – depriciation
NNP= NDP-Depriciation
Percapitaincome: NNP/population.
GNI=gdp+abroad income – payouts to abrob
GNP = GNI
NFIA = Income from abroad – indian income to abroad
or
GDP = value including foreigners income within coutry ex:MNC
GNP = GDP + foreign income – income of foreigners within the country.
GNI = GDP + foreign income – payout to foregin.
GNP — Depriciation = NNP
Gross domestic product/population = GDP per capita
GNP /GNI per capita = GNP/population
GDP per capita
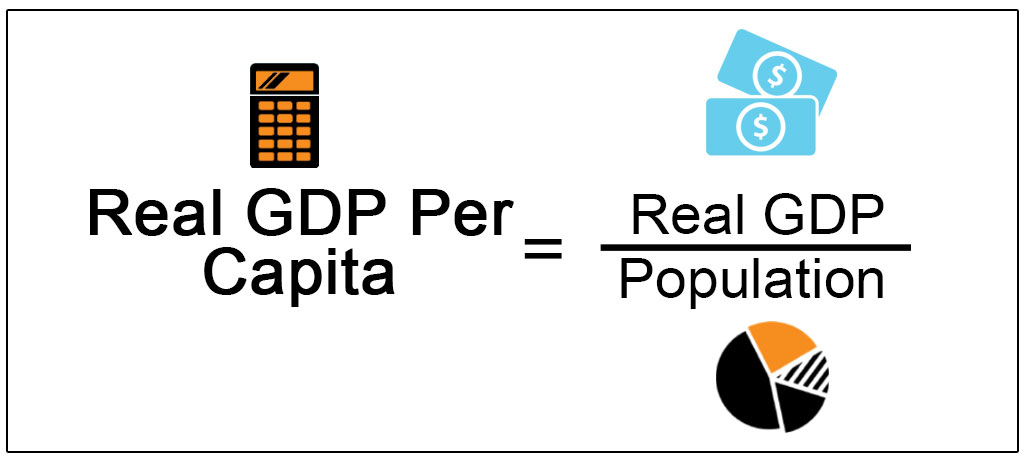
value of all the goods and services in the country/ number of ctizens
India maybe 5th /6th largest economy but percapita basis rank 122 and china at 79 us at 13 #1 qatar
US $21.5 trillion nominal gross domestic product (GDP) and an estimated $22.3 in 2020
China $14.2 trillion in 2020 and an estimated $15.7 trillion in 2020
Japan at $5.2 trillion in 2019 and an estimated $5.4 trillion in 2020
Germany at $4.2 trillion in 2019 and an estimated $4.5 trillion in 2020
The United Kingdom at $3 trillion in 2019 and an estimated $3.2 trillion in 2020
India at $2.9 trillion in 2019 and an estimated $3.3 trillion in 2020
GDP at Purchasing Power Parity (PPP) per capita
PPP takes into account the relative cost of living,
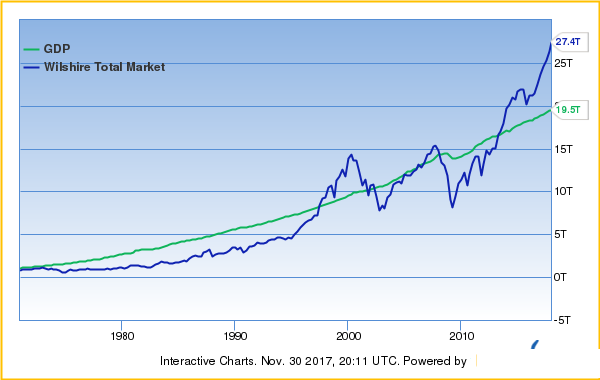
How Stock market Represt economy growth / decline?
economy = production + consumptions (business)
Almost all top Companies by Market capitalization listed on the Stock market.
Stock market Index indicates all companies growth including all sectors.
So it will reflects economy 70-90% accurate.
market cap to gdp ratio india
overall market is undervalued or overvalued compared to a historical average
total value of all publicly-traded stocks in a country,/ divided by that country’s Gross Domestic Product
Market Capitalization to GDP= SMC / GDP ×100
where:
SMC=Stock Market Capitalization
GDP=Gross Domestic Product
market cap to gdp ratio nifty index
Indian Market Cap to GDP ratio Avg: 75% (high when bull run 146%)
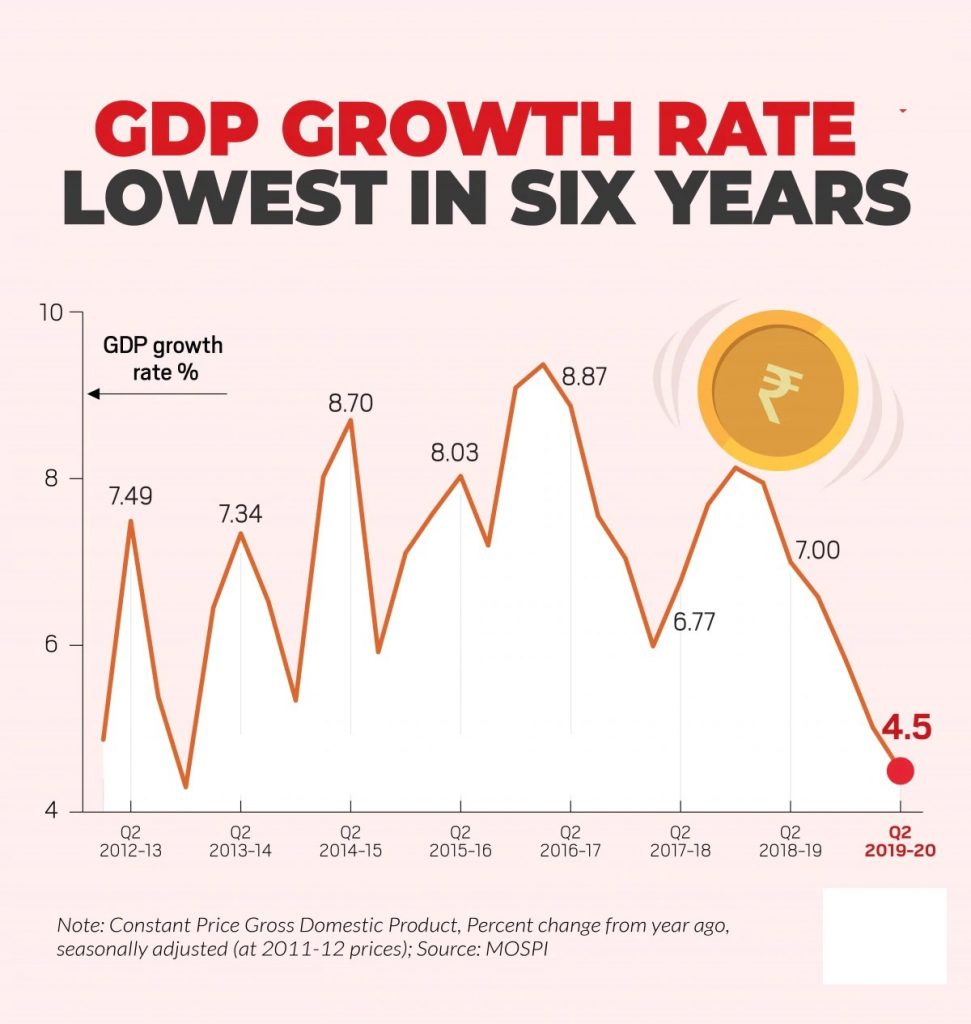
Indian GDP rate history: Avg 7-8%
Inflation may be Avg: 4%
Buffett Indicator
modestly undervalued 50 and 75%
fair valued 75 and 90%
modestly overvalued 90 and 115%
market cap of nifty 50
NSE market capitalisation fell from 65% to 29% due to the rise of sectoral indices like NIFTY Bank, NIFTY IT, NIFTY Pharma, NIFTY SERV SECTOR, NIFTY Next 50, etc
NIFTY 50 Index gives weightage of 39.47% to financial services, 15.31% to Energy, 13.01% to IT, 12.38% to Consumer Goods, 6.11 to Automobile and nil to agricultural sector.
total market cap of indian stock market 2.27 trillion
indian gdp 2.9 trillions